August, 1982, and July, 2024
I think that Kamala might be elected in a landslide. It's too early to tell, but if she were a stock, I'd be a buyer.
I have looked at the stock market since I was in my 20's. I can't say I've had constant success – I haven't – but I made enough to buy my first house when I was 33, and I took formal courses on technical analysis of the stock market at Golden Gate University with the great hank Pruden in the 1980's, and I know something about it.
I've also followed politics since the age of maybe 10. I remember the headlines about the Korean War – Inchon Landing! I remember when Truman fired MacArthur – I supported Truman. I know something about it.
What do the stock market and politics have in common? While both of them have issues of substance that one can seek to understand – they are called “policies” in politics and “fundamental analysis” in the stock market – both of them are governed by popular mass psychology. So, that's where I think the overlap is.
A lot of technical analysis works off charts – in fact, technicians are sometimes called “chartists.” The chart of stock prices shows a picture of popular opinion of what a stock is worth through a time period. Technicians try to make use of these charts to find common elements through time to be able to recognize recurrent phenomena. In other words, standard pictures that you can recognize that you have seen before.
I remember August, 1982. There had been a long decline in the market; there had been a stubborn inflation and then a rise in interest rates engineered by Paul Volker at the Fed, with the intention of producing a recession that would cool prices down. You can see it in the first half of this chart.
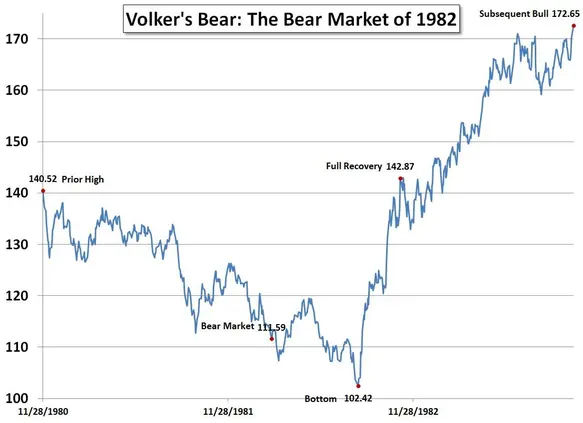
Opinion on stocks was negative, and prices reflected that negativity. In fact, opinions were so negative that some technicians (but not fundamentalists) were predicting a stock market rise, although they didn't know when, because when opinion swings strongly one way, that's a contrarian sign that there is a reversal in the future. You just don't know when.
But for here, let's just concentrate on the decline – prices were going down. They kept going down and down, everyone got depressed, and finally, even the most optimistic started to get depressed. They capitulated to pessimism – that's the technical analysis official term for what happens at such a time, capitulation. There is no one left to sell stocks, because everyone has already done so, and the last sputter is the capitulation.
And then, all of a sudden, very suddenly and unexpectedly, something happened, and prices turned around on a dime and started to shoot up. They shot up fast. Volume climbed – everyone started to pile in. No one knew why, but there it was in front of you. Mass psychology sees big changes fast. And that chart shows what the turnaround looks like. It's not tentative – not only do prices start to rise, but they do it on big volume (lots of shares traded,) out of seeming nowhere.
So, my thesis is that we could change the x-axis (the abscissa) from the first years of the 1980s to the last year or two in the 2020's, and change the y-axis (the ordinate) to Democratic popularity and “good job” ratings, and we then have picture of political mass psychology.
The popularity of Biden and the Democrats was constantly tending downward. The final event in this series was the June 27th debate. What a horror show! I was watching it alone on my blue leather couch in the TV room, and within three minutes I said – “Disaster!” Confused and slate white, mouth agape, words hard to find, Biden looked about 95 years old. He shuffled. He kind of rallied later, but the damage was done, and everyone could see it. The Democrats were cooked – put a fork in them. Even Trump didn't quite know what to do, the breakdown was so complete. His choice of JD Vance just over two weeks later reflected the capitulation; Trump thought he had it won, so he might as well get a fire-breather.
Not so fast, old man, not so fast. The last sputter of a bear market can be deceptive. Unlike the stock market, here we can discern a clear change that led to the public perception change – Biden withdrew and Kamala stepped in with authority – with great authority! How she has grown! Poised, confident story-telling, taking her time as she builds to the climax, the wind clearly in her sails. Hey, man, that was the bottom! The debate was the bottom. Look at what's ahead. It's not tentative, the financial contributions to Kamala are the equivalent of stock volume, which tracks enthusiasm – it's a bottom followed by a breakout to the upside.
So, we could trace some of the fundamentals – all the issues of the Democrats are more popular than those of the Republicans, for instance, they just have to be recognized by the people.. But the charts will tell us if we have identified it correctly. In the stock market it's the earnings that come in later, after the turn, the fundamentals follow the technicals. Politically now, the chart predicts that the polls will turn, more money will roll in, more endorsements, some good debates, etc. That will come. But right now, we're just looking at the chart, and if thing go as I think they will, we're looking at our first woman president next year, and preservation of the Biden legacy, and the much hoped-for political demise of Trump. Personally, I think it could well be a landslide.
But, in both stock market and politics, you never really know. As they say in sports, that's why they play the game. And to quote my father quoting an old English apothegm, “There's many a slip twixt the cup and the lip.”
Budd Shenkin

Landslide? How about wipeout in the other direction. You should’ve been a short seller.
ReplyDelete